immunoglobulin heavy variable 3-38 (non-functional)Genealiases: IGHV338 · VH
Q-omics provides the consensus-scored IGHV3-38 profile across patient tissues and cancer cell-line models. IGHV3-38 expression is associated with patient survival in 26 of 34 cancer types, with the highest sampling consensus in HNSC. Among the 18 cancer types available for tumor–normal comparison, IGHV3-38 is differentially expressed in 9, with the highest sampling consensus in COAD. Additionally, IGHV3-38 protein abundance shows 19,392 significant protein co-abundance associations, with the highest sampling consensus in LSCC. Together, these results highlight HNSC, COAD, and LSCC as cancer lineages where IGHV3-38 shows reproducible signals across survival, tumor–normal expression, and patient cross-omics analyses.
Every result is evaluated using two consensus scores. Sampling consensus measures how consistently a finding is reproduced within a cancer lineage across different conditions. Lineage consensus measures how broadly the result is shared across cancer types, distinguishing pan-cancer signals from lineage-specific patterns.
Premium analyses for IGHV3-38 — synthetic lethality, tumor antigen, and pembrolizumab response.
This table summarizes IGHV3-38 survival associations across molecular data types. IGHV3-38 RNA expression shows survival associations in the most cancer types (26), followed by mutation status (3) and mass-spec protein abundance (6). The rightmost column indicates the cancer type with the highest sampling consensus for each molecular layer.
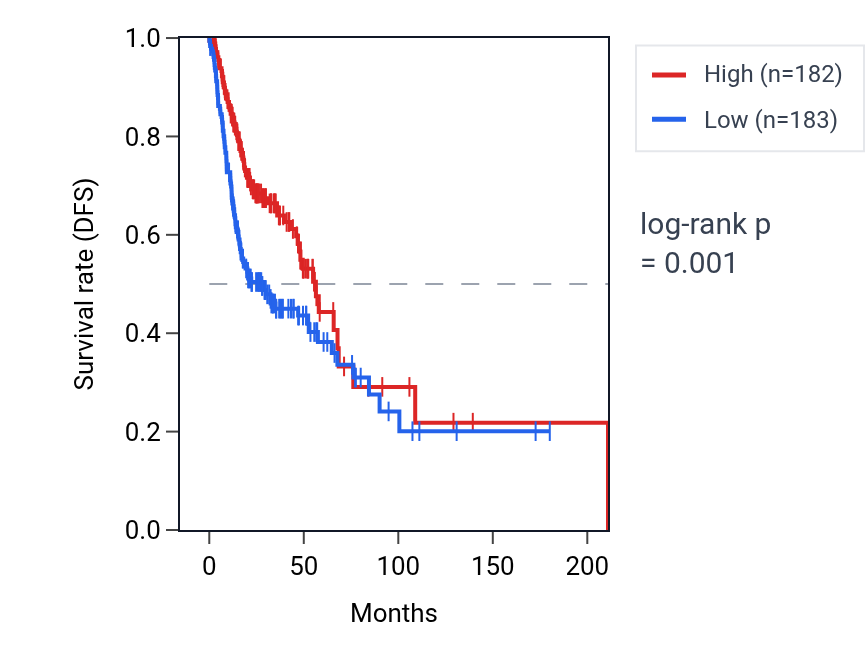
This table ranks reproducible IGHV3-38 RNA expression–survival associations across cancer types. High IGHV3-38 expression shows unfavorable associations in KIRP, but favorable associations in HNSC, BRCA, COAD, SKCM and MESO. The HNSC Kaplan–Meier curve shows clear separation, with the low-expression group declining faster, consistent with the favorable association (log-rank p < 0.001). Together, the overview and detailed table identify HNSC as the clearest survival context for IGHV3-38 RNA expression.
This table summarizes IGHV3-38 tumor–normal expression differences by data type. RNA shows broader differences across cancer types, with a lineage consensus of 9, while mass-spec protein shows differences in 6. The strongest signals are observed in COAD for RNA and LUAD for protein.
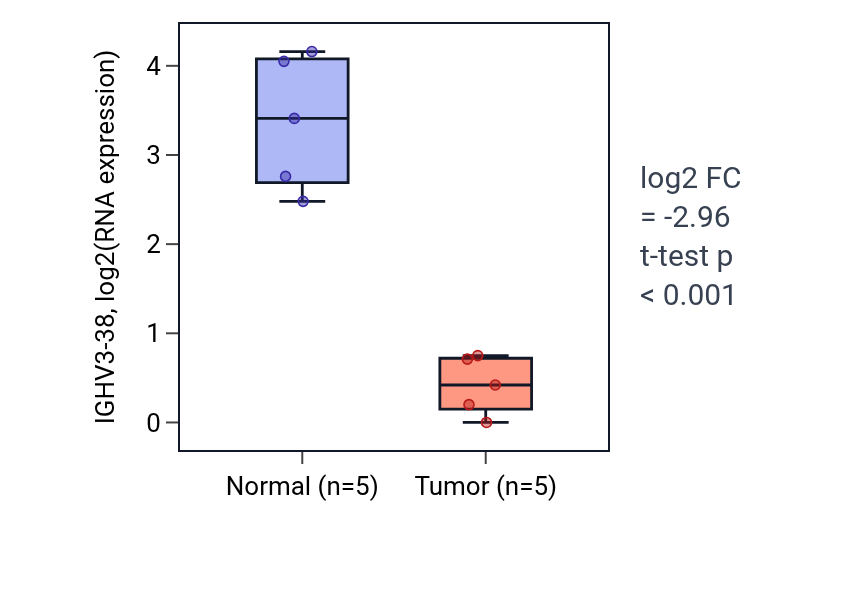
This table ranks reproducible tumor–normal expression differences for IGHV3-38. A negative fold-change indicates higher expression in normal tissue than in tumor tissue. IGHV3-38 shows lower tumor expression in COAD, READ, BRCA and LIHC and higher tumor expression in LUAD and KIRC. The COAD box plot shows higher IGHV3-38 RNA expression in normal versus tumor tissue (log2 FC = −2.956, t-test p < 0.001).
This table shows molecular features associated with IGHV3-38 in patient tissues and cancer cell lines. In patient samples, IGHV3-38 shows the broadest associations at the RNA and protein expression levels, with LSCC recurring as the lineage with the largest associated feature set.