Negative regulation of ERAD pathway

pathway activity — cross-omics
GO:1904293Cross-omicsPROTEIN-MS → PROTEIN-MSPatientPairwise association · TCGA cohorts

Across TCGA patient cohorts, RNA activity of the Negative regulation of ERAD pathway pathway is significantly associated with the protein abundance of multiple proteins, with the PDAC cohort showing a particularly strong set of associations.

The most reproducible pathway-associated proteins across cancer lineages are HACE1_S385, SLK_S565, and SRRM1_T614, each associated with the pathway in up to 4 cancer types. Since the analysis shows associations rather than directional relationships, both pathway-to-partner and partner-to-pathway views are reported.

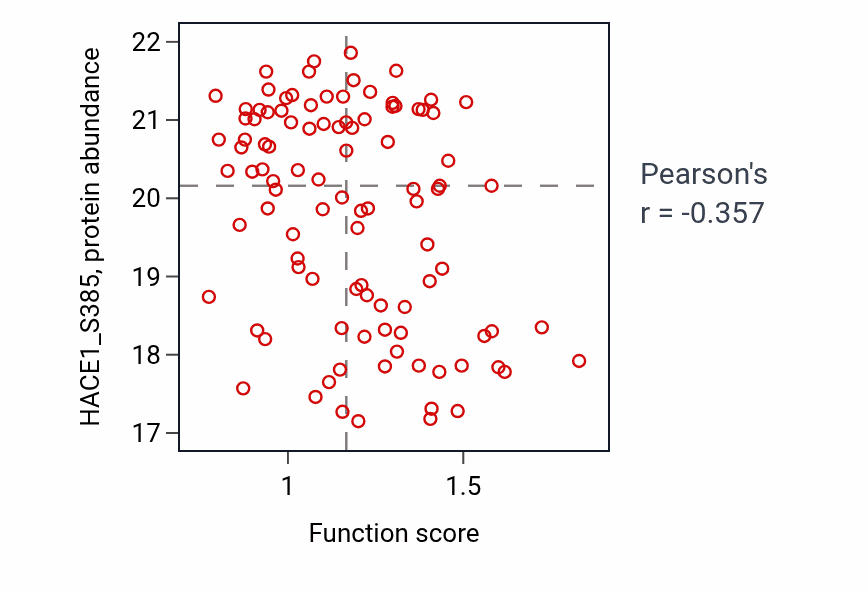
Each partner is linked to its corresponding Q-omics profile. The scatter plot shows the strongest association, Negative regulation of ERAD pathway activity versus HACE1_S385 in PDAC (Pearson r = -0.36).
Pathway-associated proteins by consensus

Ranked by combined sampling and lineage consensus. X-score (pathway→partner) and Y-score (partner→pathway) are standardized regression coefficients; both directions are reported because the association is undirected. The reported p-values are derived from the association test.
LineagePartner proteinX-scoreY-scorep(X)p(Y)Sampling consensusLineage consensus
PDACHACE1_S385 →-1.262-0.174<.001.00134
OVSLK_S565 →+1.474+0.408<.001.00233
LSCCSRRM1_T614 →+0.227+0.163<.001.00133
PDACTACC1_S153 →-1.246-0.219.002.00133
PDACUSP42 →+0.729+0.296.001<.00133
PDACZFYVE16_S946 →-0.640-0.163.001.00224
Each partner links to its Q-omics profile. Showing the 6 strongest associations by consensus.

GO:1904293 vs HACE1_S385 — PDAC

Per-sample scatter of Negative regulation of ERAD pathway activity vs HACE1_S385 in PDAC.

Explore this scatter interactively →

Exploration