Cardiac conduction system development
pathway activity — tumor vs normalAcross TCGA pan-cancer cohorts, RNA activity of the Cardiac conduction system development pathway differs between tumor and matched normal tissue in 9 of the 18 cancer types tested.
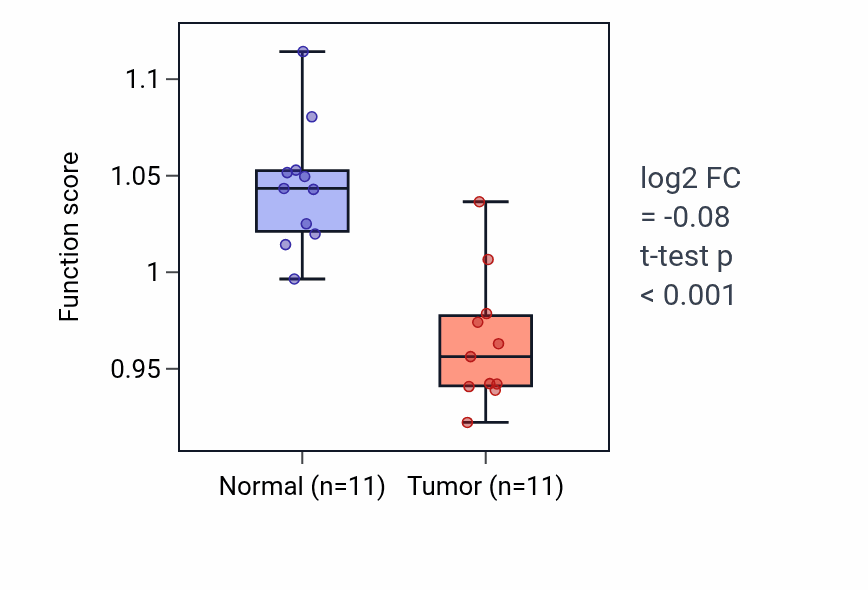
The strongest signal is observed in kidney chromophobe (KICH), where pathway activity is lower in tumor tissue than in matched normal tissue. In most cancer types, this pathway shows higher activity in tumors, although a few cancer types, such as KICH and LUAD, show the opposite pattern, with lower activity in tumor tissue.
KICH, LUAD, and BLCA show the most reproducible tumor–normal differences in pathway activity.
Tumor vs normal pathway activity by lineage
Ranked by sampling consensus. Activity change represents the tumor-versus-normal difference in pathway activity on a log2 scale. Positive values indicate higher pathway activity in tumor tissue. The reported p-values are derived from the corresponding differential activity tests.
Pink = more active in tumor, green = less active in tumor. Showing the 9 strongest of 9 lineages.
Exploration
- Same pathway, other analysis: Cardiac conduction system development activity & survival · full GO:0003161 profile