PTGDR

RNA expression — cross-omics
Cross-omicsRNA → FUNCTION-RNACell-linePairwise association · TCGA cohorts

Across TCGA cell cohorts, PTGDR RNA expression is significantly associated with the go_rna of many other GO terms, with 173 significant associations in total. CNS shows the largest number of these associations.

The most reproducible PTGDR-associated GO terms across cancer lineages are Positive regulation of intracellular transport, Response to acid chemical, and Protein folding in endoplasmic reticulum. Each is linked with PTGDR in more than 4 cancer types. Because this analysis shows association rather than direction, both PTGDR-to-partner and partner-to-PTGDR results are reported.

Each partner links to its own Q-omics profile. The box plot shows the strongest example, Positive regulation of intracellular transport grouped by PTGDR-low versus PTGDR-high in CNS.

RNA expression associated GO terms by consensus

Ranked by combined sampling and lineage consensus. X-score (PTGDR→partner) and Y-score (partner→PTGDR) are standardized regression coefficients; both directions are reported because the association is undirected. p-values are from the association test.
LineagePartner GO termX-scoreY-scorep(X)p(Y)Sampling consensusLineage consensus
CNSPositive regulation of intracellular transport →+0.054+0.053<.001.00535
CNSResponse to acid chemical →+0.028+0.036.005.00933
SOFT_TISSUEProtein folding in endoplasmic reticulum →+0.102+0.035<.001.00833
CNSNegative regulation of protein catabolic process →+0.037+0.039<.001.00433
CNSEndothelial cell migration →+0.058+0.038.003.00533
CNSCotranslational protein targeting to membrane →+0.074+0.053<.001.00733
Each partner links to its Q-omics profile. Showing the 6 strongest of 173 associations by consensus.

Positive regulation of intracellular transport by PTGDR expression — CNS
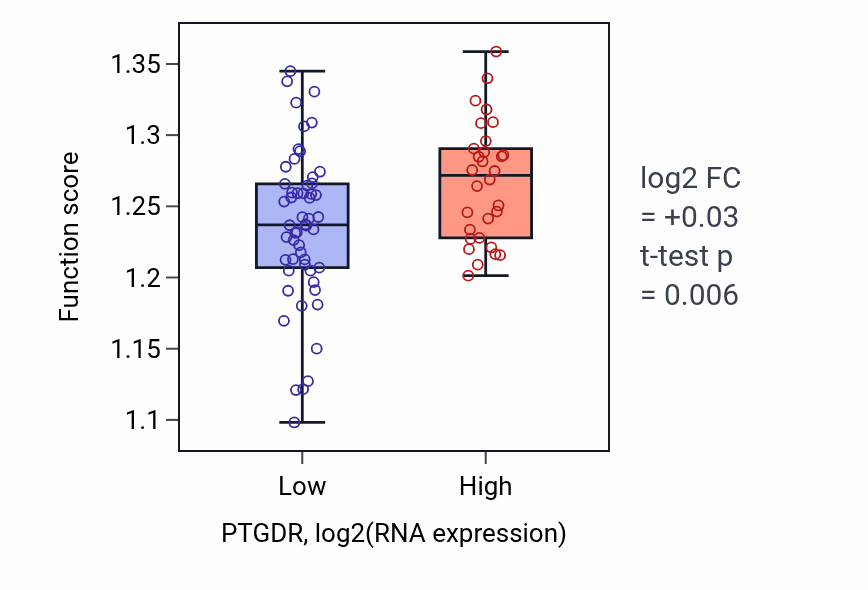
Box plot of Positive regulation of intracellular transport in PTGDR-low vs PTGDR-high samples in CNS.

Explore this box plot interactively →

Exploration