C1QTNF9
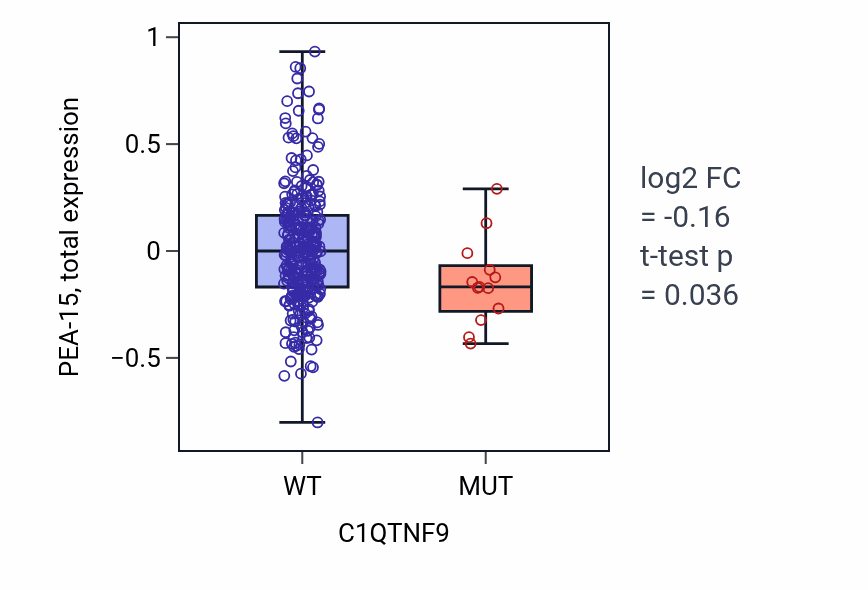
mutation — cross-omicsAcross TCGA patient cohorts, C1QTNF9 mutation is significantly associated with the total protein of many other genes, with 9 significant associations in total. SKCM shows the largest number of these associations.
The most reproducible C1QTNF9-associated genes across cancer lineages are PEA-15, Smac, and Tuberin. Each is linked with C1QTNF9 in more than 1 cancer types. Because this analysis shows association rather than direction, both C1QTNF9-to-partner and partner-to-C1QTNF9 results are reported.
Each partner links to its own Q-omics profile. The box plot shows the strongest example, PEA-15 grouped by C1QTNF9-low versus C1QTNF9-high in SKCM.
mutation associated genes by consensus
Ranked by combined sampling and lineage consensus. X-score (C1QTNF9→partner) and Y-score (partner→C1QTNF9) are standardized regression coefficients; both directions are reported because the association is undirected. p-values are from the association test.
Each partner links to its Q-omics profile. Showing the 6 strongest of 9 associations by consensus.