Regulation of cellular response to transforming growth factor beta stimulus

pathway activity — cross-omics
GO:1903844Cross-omicsRNA → RNACellPairwise association · TCGA cohorts

Across TCGA cell cohorts, RNA activity of the Regulation of cellular response to transforming growth factor beta stimulus pathway is significantly associated with the RNA expression of multiple genes, with the BONE cohort showing a particularly strong set of associations.

The most reproducible pathway-associated genes across cancer lineages are PLEKHA3, SLAIN2, and ZFAND3, each associated with the pathway in up to 15 cancer types. Since the analysis shows associations rather than directional relationships, both pathway-to-partner and partner-to-pathway views are reported.

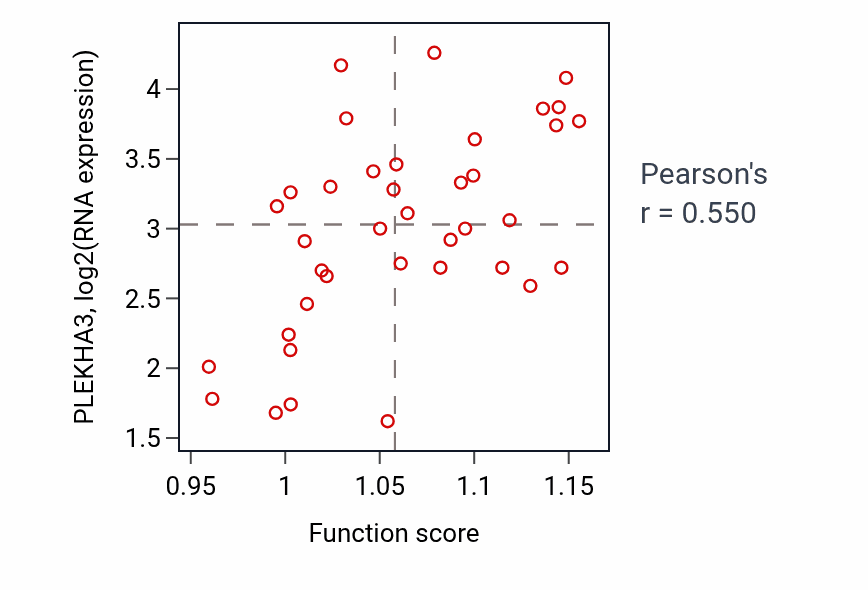
Each partner is linked to its corresponding Q-omics profile. The scatter plot shows the strongest association, Regulation of cellular response to transforming growth factor beta stimulus activity versus PLEKHA3 in BONE (Pearson r = 0.55).
Pathway-associated genes by consensus

Ranked by combined sampling and lineage consensus. X-score (pathway→partner) and Y-score (partner→pathway) are standardized regression coefficients; both directions are reported because the association is undirected. The reported p-values are derived from the association test.
LineagePartner geneX-scoreY-scorep(X)p(Y)Sampling consensusLineage consensus
BONEPLEKHA3 →+1.067+0.088<.001<.001315
BONESLAIN2 →+1.361+0.089<.001<.001315
LARGE_INTESTINEZFAND3 →+1.022+0.052<.001.001315
BONEZNF827 →+1.847+0.098<.001<.001315
BREASTMAP3K2 →+0.751+0.039.001.005315
BONEDYNC1H1 →+1.287+0.068<.001.005314
Each partner links to its Q-omics profile. Showing the 6 strongest associations by consensus.

GO:1903844 vs PLEKHA3 — BONE

Per-sample scatter of Regulation of cellular response to transforming growth factor beta stimulus activity vs PLEKHA3 in BONE.

Explore this scatter interactively →

Exploration