Quinolinate metabolic process

pathway activity — cross-omics
GO:0046874Cross-omicsPROTEIN-MS → DRUGCellPairwise association · TCGA cohorts

Across TCGA cell cohorts, RNA activity of the Quinolinate metabolic process pathway is significantly associated with the drug response of multiple features, with the BLOOD_Lymphoma cohort showing a particularly strong set of associations.

The most reproducible pathway-associated features across cancer lineages are Vismodegib, Paclitaxel, and EPZ004777, each associated with the pathway in up to 1 cancer types. Since the analysis shows associations rather than directional relationships, both pathway-to-partner and partner-to-pathway views are reported.

Each partner is linked to its corresponding Q-omics profile. The box plot shows the strongest association, Vismodegib grouped by Quinolinate metabolic process-low versus -high activity in BLOOD_Lymphoma.

Pathway-associated features by consensus

Ranked by combined sampling and lineage consensus. X-score (pathway→partner) and Y-score (partner→pathway) are standardized regression coefficients; both directions are reported because the association is undirected. The reported p-values are derived from the association test.
LineagePartner featureX-scoreY-scorep(X)p(Y)Sampling consensusLineage consensus
BLOOD_LymphomaVismodegib →-0.597-1.739.048<.00131
BLOOD_LymphomaPaclitaxel →-0.609-1.855.041.00231
BLOOD_LymphomaEPZ004777 →-0.597-1.739.001<.00131
BLOOD_LymphomaICL1100013 →-1.168-1.642.019<.00131
BLOOD_LymphomaEntinostat →-0.777-1.739.006<.00131
BLOOD_LymphomaAZD5991 →-2.635-1.868.023.03231
Each partner links to its Q-omics profile. Showing the 6 strongest associations by consensus.

Vismodegib by Quinolinate metabolic process activity — BLOOD_Lymphoma
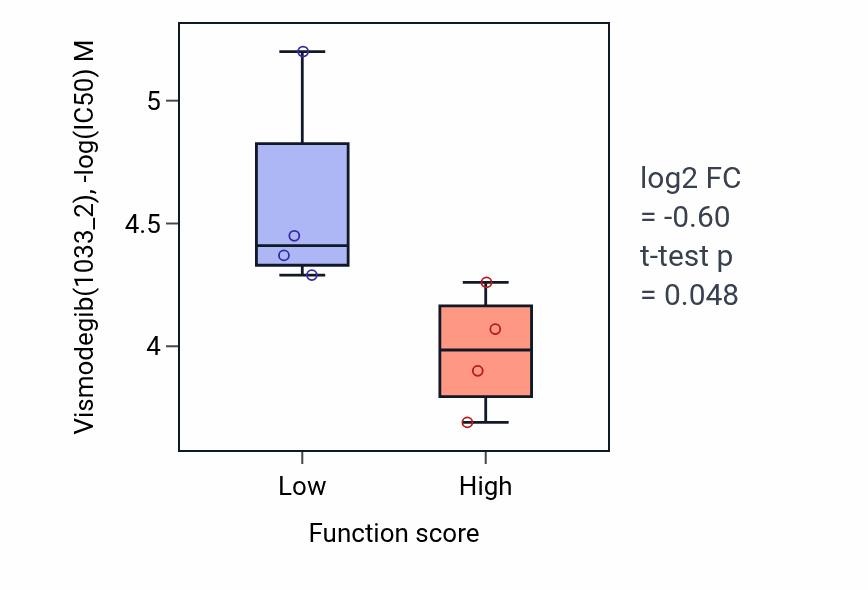
Box plot of Vismodegib in Quinolinate metabolic process-low vs -high samples in BLOOD_Lymphoma.

Explore this box plot interactively →

Exploration