"Synaptic transmission, glutamatergic"
pathway activity & survivalAcross TCGA pan-cancer cohorts, RNA activity of the "Synaptic transmission, glutamatergic" pathway is associated with patient survival in 27 of 34 cancer lineages. Pathway activity is summarized from the expression of its 110 member genes.
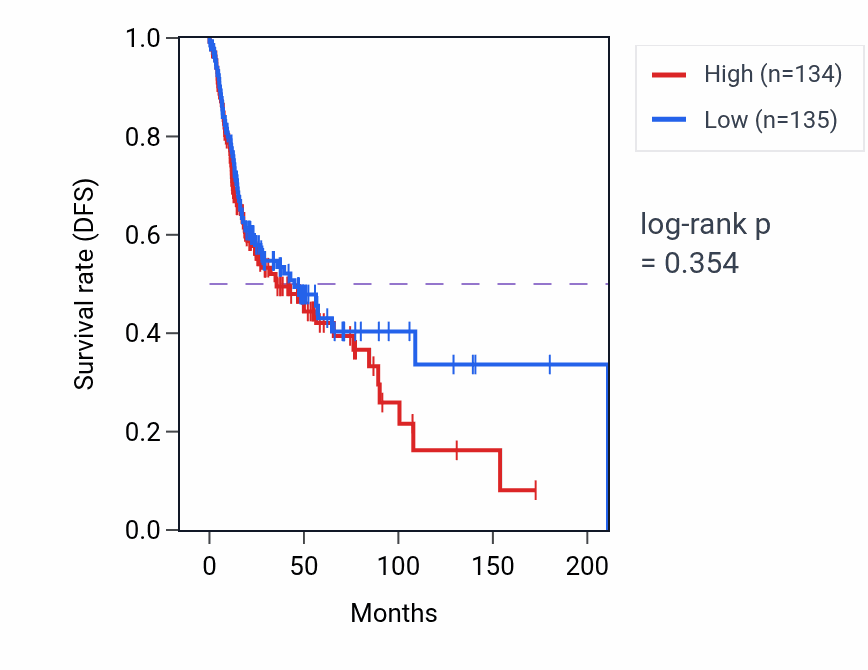
The strongest signal is observed in head and neck squamous cell carcinoma (HNSC), where higher "Synaptic transmission, glutamatergic" pathway activity is associated with poorer disease-free survival. In most high-consensus cancer types, elevated pathway activity shows an unfavorable survival association, although some cancer types, such as KIRP and LGG, show the opposite pattern, with higher activity associated with better survival.
HNSC, BLCA, and KIRP are the cancer lineages in which this pathway most reproducibly stratifies patient survival.
Pathway-activity survival associations by lineage
Exploration
- Same pathway, other analysis: tumor-vs-normal "Synaptic transmission, glutamatergic" activity · full GO:0035249 profile