Hindbrain radial glia guided cell migration

pathway activity — cross-omics
GO:0021932Cross-omicsRNA → PROTEIN-MSPatientPairwise association · TCGA cohorts

Across TCGA patient cohorts, RNA activity of the Hindbrain radial glia guided cell migration pathway is significantly associated with the protein abundance of multiple proteins, with the PDAC cohort showing a particularly strong set of associations.

The most reproducible pathway-associated proteins across cancer lineages are CRTAP, AEBP1, and FN1, each associated with the pathway in up to 8 cancer types. Since the analysis shows associations rather than directional relationships, both pathway-to-partner and partner-to-pathway views are reported.

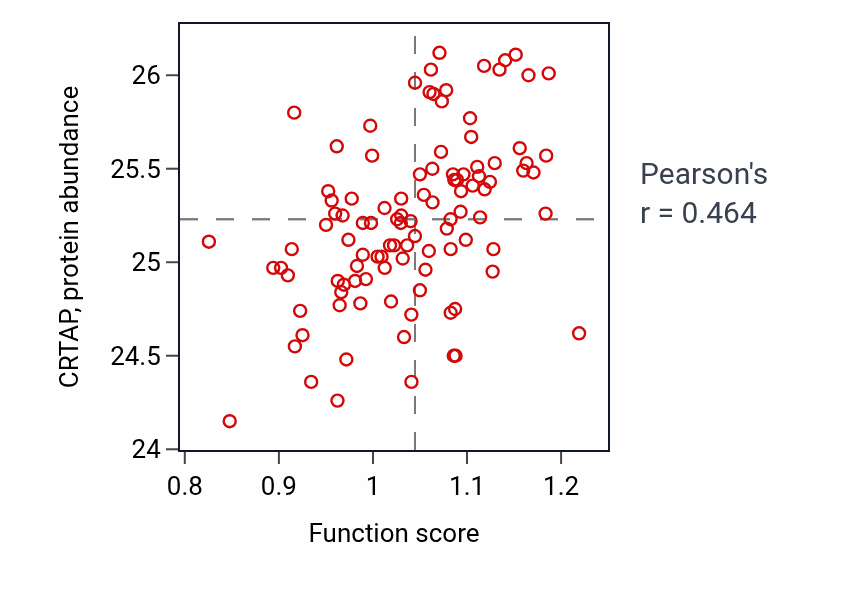
Each partner is linked to its corresponding Q-omics profile. The scatter plot shows the strongest association, Hindbrain radial glia guided cell migration activity versus CRTAP in PDAC (Pearson r = 0.46).
Pathway-associated proteins by consensus

Ranked by combined sampling and lineage consensus. X-score (pathway→partner) and Y-score (partner→pathway) are standardized regression coefficients; both directions are reported because the association is undirected. The reported p-values are derived from the association test.
LineagePartner proteinX-scoreY-scorep(X)p(Y)Sampling consensusLineage consensus
PDACCRTAP →+0.399+0.059.001.00238
PDACAEBP1 →+0.632+0.074.001<.00137
LUADFN1 →+0.506+0.051<.001.00137
PDACSFRP2 →+0.823+0.069<.001<.00136
LSCCVCAN →+0.851+0.082<.001<.00136
PDACCTHRC1 →+0.791+0.097<.001<.00136
Each partner links to its Q-omics profile. Showing the 6 strongest associations by consensus.

GO:0021932 vs CRTAP — PDAC

Per-sample scatter of Hindbrain radial glia guided cell migration activity vs CRTAP in PDAC.

Explore this scatter interactively →

Exploration