LINC01887
RNA expression — cross-omicsAcross TCGA patient cohorts, LINC01887 RNA expression is significantly associated with the RNA expression of many other genes, with 8,011 significant associations in total. ESCA shows the largest number of these associations.
The most reproducible LINC01887-associated genes across cancer lineages are CLEC2D, BCL11A, and TNFRSF13C. Each is linked with LINC01887 in more than 12 cancer types. Because this analysis shows association rather than direction, both LINC01887-to-partner and partner-to-LINC01887 results are reported.
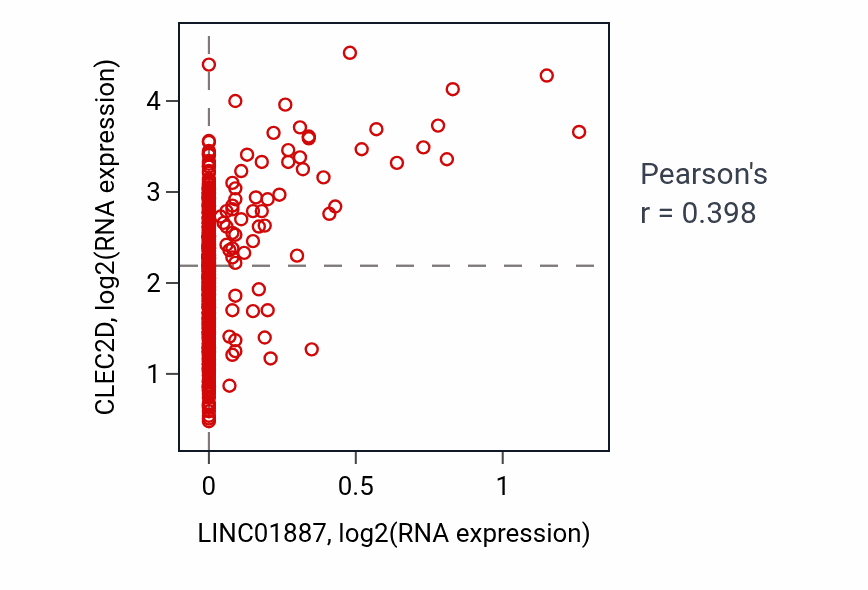
Each partner links to its own Q-omics profile. The scatter plot shows the strongest example, LINC01887 versus CLEC2D in THCA, with a Pearson correlation of 0.40.
RNA expression associated genes by consensus
Ranked by combined sampling and lineage consensus. X-score (LINC01887→partner) and Y-score (partner→LINC01887) are standardized regression coefficients; both directions are reported because the association is undirected. p-values are from the association test.
Each partner links to its Q-omics profile. Showing the 6 strongest of 8,011 associations by consensus.