Negative regulation of T cell migration
pathway activity — cross-omicsAcross TCGA cell cohorts, RNA activity of the Negative regulation of T cell migration pathway is significantly associated with the shRNA dependency of multiple genes, with the URINARY_TRACT cohort showing a particularly strong set of associations.
The most reproducible pathway-associated genes across cancer lineages are MED4, TIPARP, and MIDEAS, each associated with the pathway in up to 5 cancer types. Since the analysis shows associations rather than directional relationships, both pathway-to-partner and partner-to-pathway views are reported.
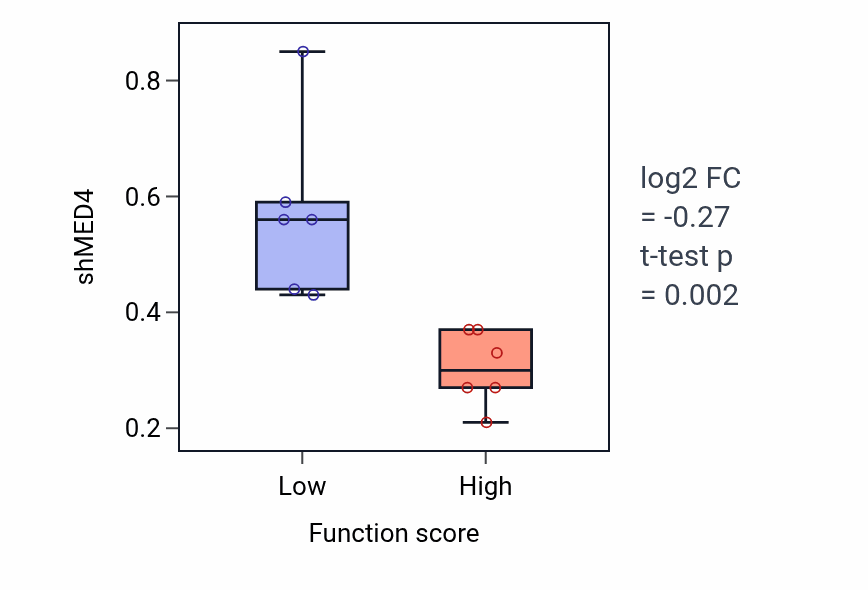
Each partner is linked to its corresponding Q-omics profile. The box plot shows the strongest association, MED4 grouped by Negative regulation of T cell migration-low versus -high activity in URINARY_TRACT.
Pathway-associated genes by consensus
MED4 by Negative regulation of T cell migration activity — URINARY_TRACT