Integrated stress response signaling
pathway activity — cross-omicsAcross TCGA cell cohorts, RNA activity of the Integrated stress response signaling pathway is significantly associated with the RNA expression of multiple genes, with the CNS cohort showing a particularly strong set of associations.
The most reproducible pathway-associated genes across cancer lineages are WARS2, NCS1, and PLCE1, each associated with the pathway in up to 6 cancer types. Since the analysis shows associations rather than directional relationships, both pathway-to-partner and partner-to-pathway views are reported.
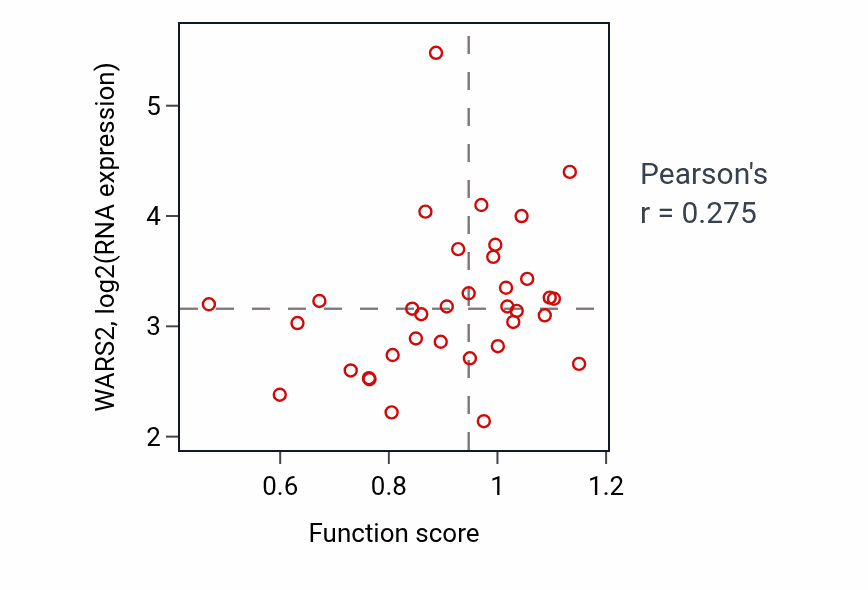
Each partner is linked to its corresponding Q-omics profile. The scatter plot shows the strongest association, Integrated stress response signaling activity versus WARS2 in CNS (Pearson r = 0.28).
Pathway-associated genes by consensus
Ranked by combined sampling and lineage consensus. X-score (pathway→partner) and Y-score (partner→pathway) are standardized regression coefficients; both directions are reported because the association is undirected. The reported p-values are derived from the association test.
Each partner links to its Q-omics profile. Showing the 6 strongest associations by consensus.