Establishment of epithelial cell apical/basal polarity

pathway activity — cross-omics
GO:0045198Cross-omicsPROTEIN-MS → RNAPatientPairwise association · TCGA cohorts

Across TCGA patient cohorts, RNA activity of the Establishment of epithelial cell apical/basal polarity pathway is significantly associated with the RNA expression of multiple genes, with the HNSC cohort showing a particularly strong set of associations.

The most reproducible pathway-associated genes across cancer lineages are NDUFA9, HILPDA, and DCLRE1C, each associated with the pathway in up to 4 cancer types. Since the analysis shows associations rather than directional relationships, both pathway-to-partner and partner-to-pathway views are reported.

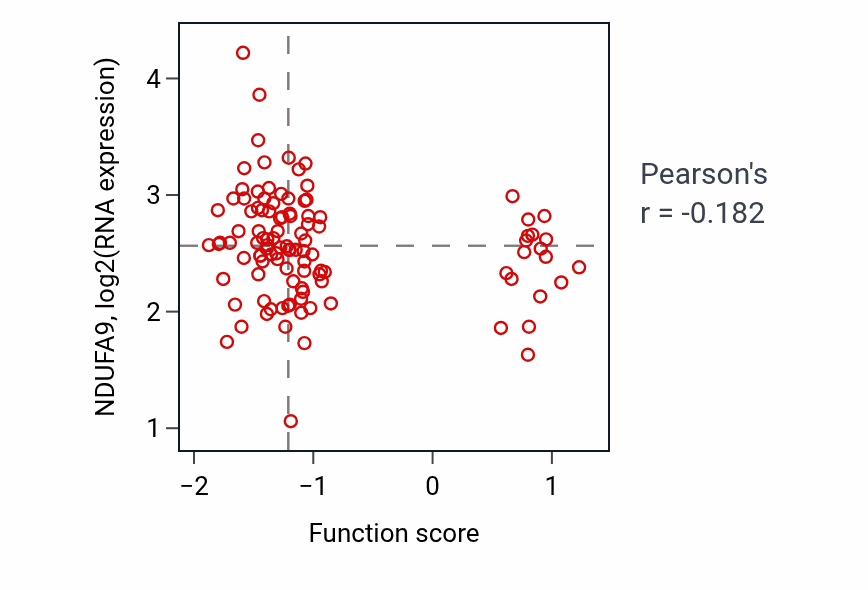
Each partner is linked to its corresponding Q-omics profile. The scatter plot shows the strongest association, Establishment of epithelial cell apical/basal polarity activity versus NDUFA9 in HNSC (Pearson r = -0.18).
Pathway-associated genes by consensus

Ranked by combined sampling and lineage consensus. X-score (pathway→partner) and Y-score (partner→pathway) are standardized regression coefficients; both directions are reported because the association is undirected. The reported p-values are derived from the association test.
LineagePartner geneX-scoreY-scorep(X)p(Y)Sampling consensusLineage consensus
HNSCNDUFA9 →-0.314-0.531<.001.00534
UCECHILPDA →+1.105+0.798<.001<.00133
HNSCDCLRE1C →-0.385-0.779.001.00333
HNSCCSTB →+1.049+0.676<.001<.00133
HNSCDMKN →+1.244+0.724<.001.00133
HNSCPOGLUT1 →-0.347-1.008.004<.00133
Each partner links to its Q-omics profile. Showing the 6 strongest associations by consensus.

GO:0045198 vs NDUFA9 — HNSC

Per-sample scatter of Establishment of epithelial cell apical/basal polarity activity vs NDUFA9 in HNSC.

Explore this scatter interactively →

Exploration