Spliceosomal complex assembly

pathway activity & survival
GO:0000245SurvivalRNA activityKaplan–Meier · TCGA cohorts

Across TCGA pan-cancer cohorts, RNA activity of the Spliceosomal complex assembly pathway is associated with patient survival in 26 of 34 cancer lineages. Pathway activity is summarized from the expression of its 91 member genes.

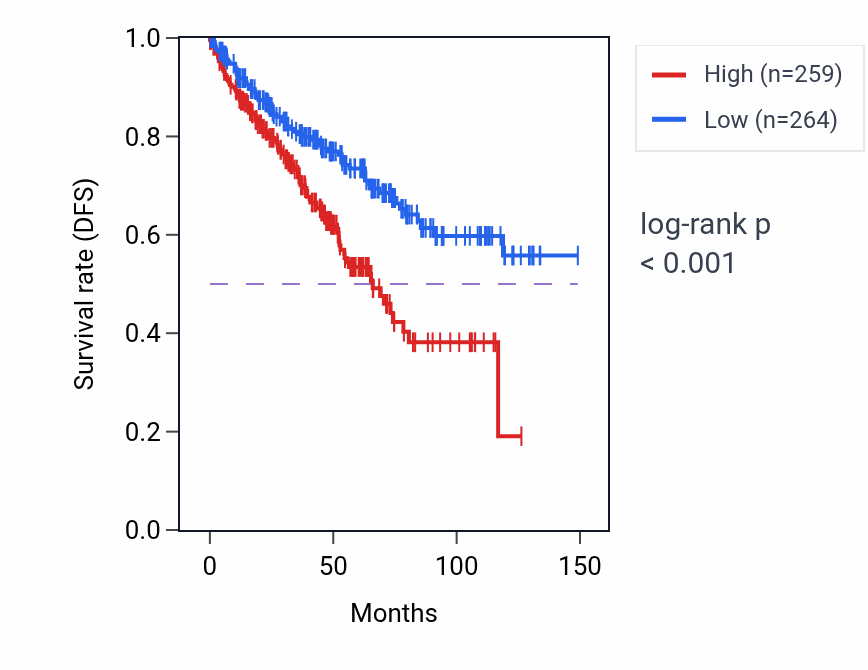
The strongest signal is observed in kidney renal clear cell carcinoma (KIRC), where higher Spliceosomal complex assembly pathway activity is associated with poorer disease-free survival. In most high-consensus cancer types, elevated pathway activity shows an unfavorable survival association, although some cancer types, such as UCS and BRCA, show the opposite pattern, with higher activity associated with better survival.

KIRC, KIRP, and UCEC are the cancer lineages in which this pathway most reproducibly stratifies patient survival.

Pathway-activity survival associations by lineage
Ranked by sampling consensus. AUC1 and AUC2 represent the survival AUCs for the high- and low-pathway-activity groups, respectively. The group with the lower AUC is interpreted as having poorer survival. The reported p-values are derived from the log-rank test.
LineageMeasureSplitStageAUC1
high
AUC2
low
pSampling consensus
KIRCDFSMedianAll0.5520.687<.001100view →
KIRPDFSMedianAll0.3540.736<.00181view →
UCECDFSMedianAll0.7880.880.00174view →
ACCOSQuartileAll0.5820.936<.00169view →
UCSDFSTertileII,III,IV0.6050.181<.00156view →
UVMDFSQuartileAll0.2340.670.00154view →
LIHCDFSTertileAll0.3110.476<.00148view →
PRADDFSMedianAll0.7130.819<.00136view →
BRCADFSTertileIII,IV0.8960.713.00235view →
THCADFSQuartileII,III,IV0.7250.936<.00126view →
THYMDFSQuartileII,III,IV1.0000.454.00724view →
LAMLDFSQuartileAll0.6350.247.02018view →
Pink = unfavorable, green = favorable. Showing the 12 strongest of 26 lineages.

GO:0000245–KIRC (DFS)

Kaplan–Meier survival curve for Spliceosomal complex assembly pathway activity in KIRC.

Open the KIRC breakdown →

Exploration