RNU1-139P

associated omics data
RNA, U1 small nuclear 139, pseudogeneGenealiases: []

Q-omics provides the consensus-scored RNU1-139P profile across patient tissues and cancer cell-line models. RNU1-139P expression is associated with patient survival in 7 of 34 cancer types, with the highest sampling consensus in UCS. Additionally, RNU1-139P RNA expression shows 7,504 significant gene co-expression associations, with the highest sampling consensus in BRCA. Together, these results highlight UCS, and BRCA as cancer lineages where RNU1-139P shows reproducible signals across survival, tumor–normal expression, and patient cross-omics analyses.

Every result is evaluated using two consensus scores. Sampling consensus measures how consistently a finding is reproduced within a cancer lineage across different conditions. Lineage consensus measures how broadly the result is shared across cancer types, distinguishing pan-cancer signals from lineage-specific patterns.
Survival associations

This table summarizes RNU1-139P survival associations across molecular data types. RNU1-139P RNA expression shows survival associations in the most cancer types (7). The rightmost column indicates the cancer type with the highest sampling consensus for each molecular layer.
RNU1-139P data typeSurvival analysisLineage consensusLineage of highest sampling consensus
RNAKaplan–Meier7UCS (126)view →
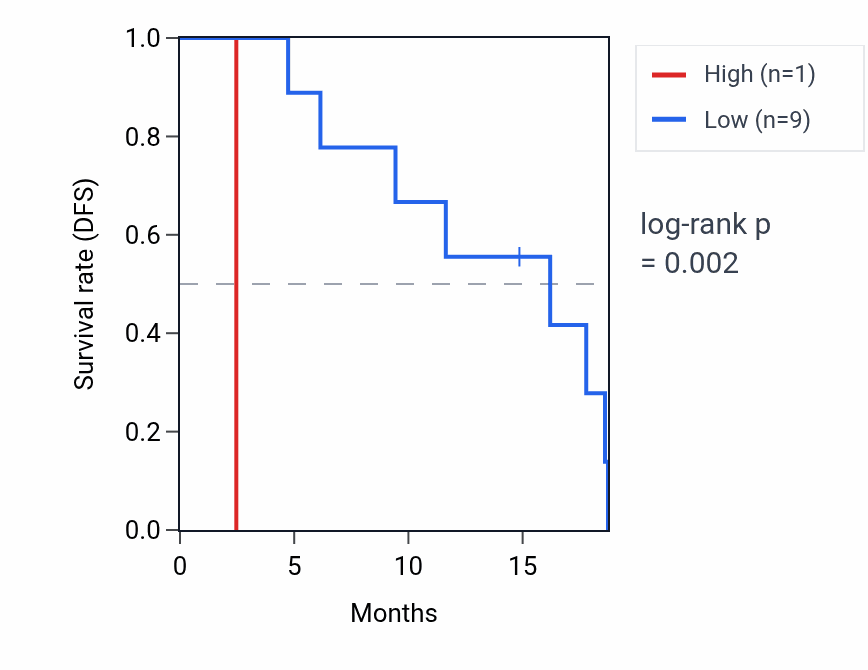
This table ranks reproducible RNU1-139P RNA expression–survival associations across cancer types. High RNU1-139P expression shows unfavorable associations in UCS, CESC, ESCA, LIHC, TGCT and UCEC. The UCS Kaplan–Meier curve shows clear separation, with the high-expression group declining faster, consistent with the unfavorable association (log-rank p = .002). Together, the overview and detailed table identify UCS as the clearest survival context for RNU1-139P RNA expression.
LineageMeasureSplitStageAUC1
high
AUC2
low
pSampling consensus
UCSDFSTertileIV0.1320.718.002126view →
CESCOSTertileII,III,IV0.0680.830<.00172view →
ESCAOSTertileAll0.3020.711<.00145view →
LIHCOSTertileAll0.0980.774.00145view →
TGCTOSTertileAll0.6940.968<.00118view →
UCECOSTertileAll0.1220.679.03018view →
Pink = unfavorable, green = favorable. all 7 lineages →

RNU1-139P-UCS (DFS)

Kaplan–Meier survival curve for RNU1-139P RNA expression in UCS: high vs low expression groups.

Explore this curve interactively →

Cross-omics associations

This table shows molecular features associated with RNU1-139P in patient tissues and cancer cell lines. In patient samples, RNU1-139P shows the broadest associations at the RNA and protein expression levels, with BRCA recurring as the lineage with the largest associated feature set.
Associated data typeStrength (# associated data)Lineage of highest associated data
RNA
RNA7,504BRCA (3370)view →
Function (RNA)5,432STAD (5319)view →