Q-omics provides the consensus-scored RNA5SP93 profile across patient tissues and cancer cell-line models. RNA5SP93 expression is associated with patient survival in 7 of 34 cancer types, with the highest sampling consensus in MESO. Among the 18 cancer types available for tumor–normal comparison, RNA5SP93 is differentially expressed in 2, with the highest sampling consensus in KIRC. Additionally, RNA5SP93 RNA expression shows 9,283 significant protein co-abundance associations, with the highest sampling consensus in CCRCC. Together, these results highlight MESO, KIRC, and CCRCC as cancer lineages where RNA5SP93 shows reproducible signals across survival, tumor–normal expression, and patient cross-omics analyses.
Every result is evaluated using two consensus scores. Sampling consensus measures how consistently a finding is reproduced within a cancer lineage across different conditions. Lineage consensus measures how broadly the result is shared across cancer types, distinguishing pan-cancer signals from lineage-specific patterns.
Premium analyses for RNA5SP93 — synthetic lethality, tumor antigen, and pembrolizumab response.
This table summarizes RNA5SP93 survival associations across molecular data types. RNA5SP93 RNA expression shows survival associations in the most cancer types (7). The rightmost column indicates the cancer type with the highest sampling consensus for each molecular layer.
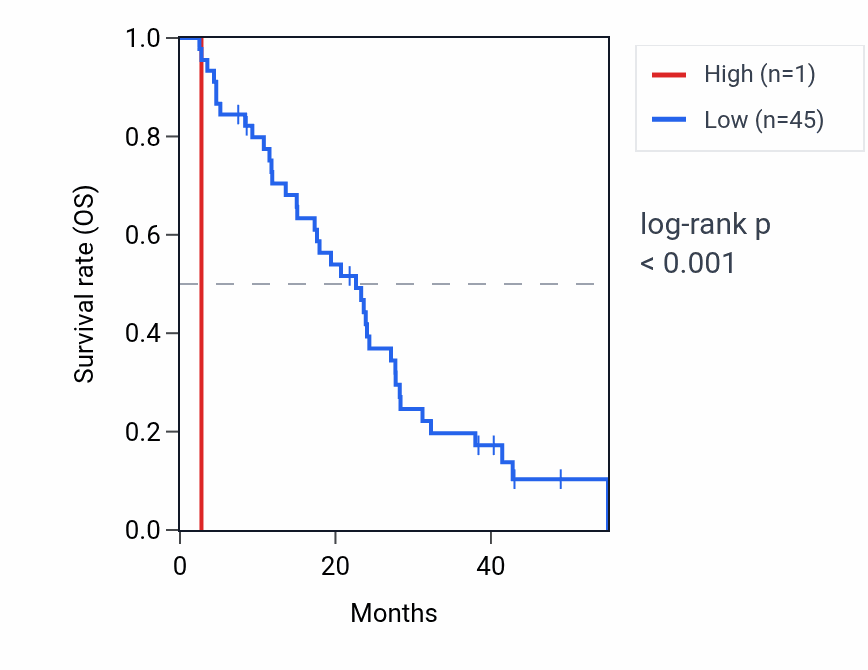
This table ranks reproducible RNA5SP93 RNA expression–survival associations across cancer types. High RNA5SP93 expression shows unfavorable associations in MESO, KIRC, LUSC, SKCM, LUAD and THCA. The MESO Kaplan–Meier curve shows clear separation, with the high-expression group declining faster, consistent with the unfavorable association (log-rank p < 0.001). Together, the overview and detailed table identify MESO as the clearest survival context for RNA5SP93 RNA expression.
This table summarizes RNA5SP93 tumor–normal expression differences by data type. RNA shows broader differences across cancer types, with a lineage consensus of 2. The strongest signals are observed in KIRC for RNA.
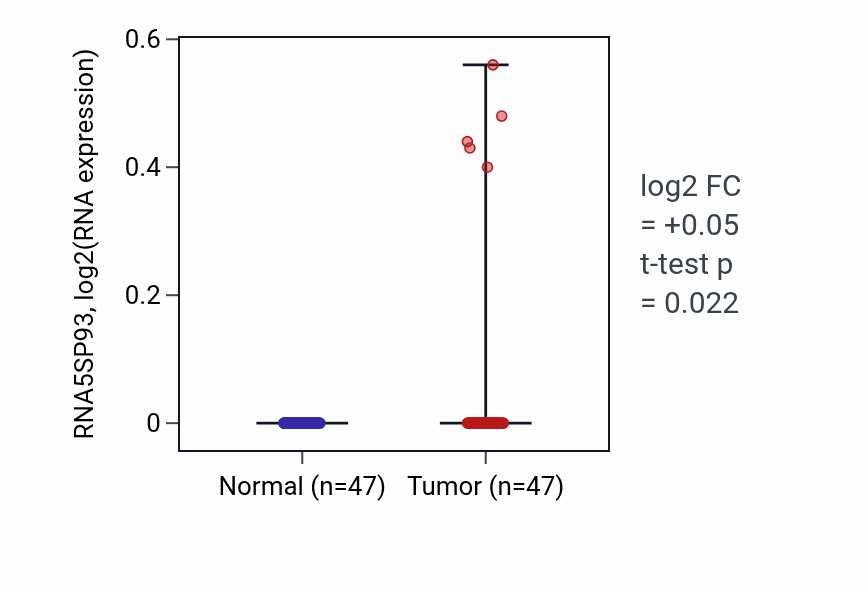
This table ranks reproducible tumor–normal expression differences for RNA5SP93. A negative fold-change indicates higher expression in normal tissue than in tumor tissue. RNA5SP93 shows lower tumor expression in THCA and higher tumor expression in KIRC. The KIRC box plot shows higher RNA5SP93 RNA expression in tumor versus normal tissue (log2 FC = +0.049, t-test p = .022).
This table shows molecular features associated with RNA5SP93 in patient tissues and cancer cell lines. In patient samples, RNA5SP93 shows the broadest associations at the RNA and protein expression levels, with CCRCC recurring as the lineage with the largest associated feature set.