PEAK1
mass-spec protein & survivalAcross TCGA pan-cancer cohorts, PEAK1 mass-spec protein is linked to patient survival in 6 of 34 cancer types, making it a survival-associated PEAK1 data layer compared with 24 for mass-spec protein and 3 for mutation status.
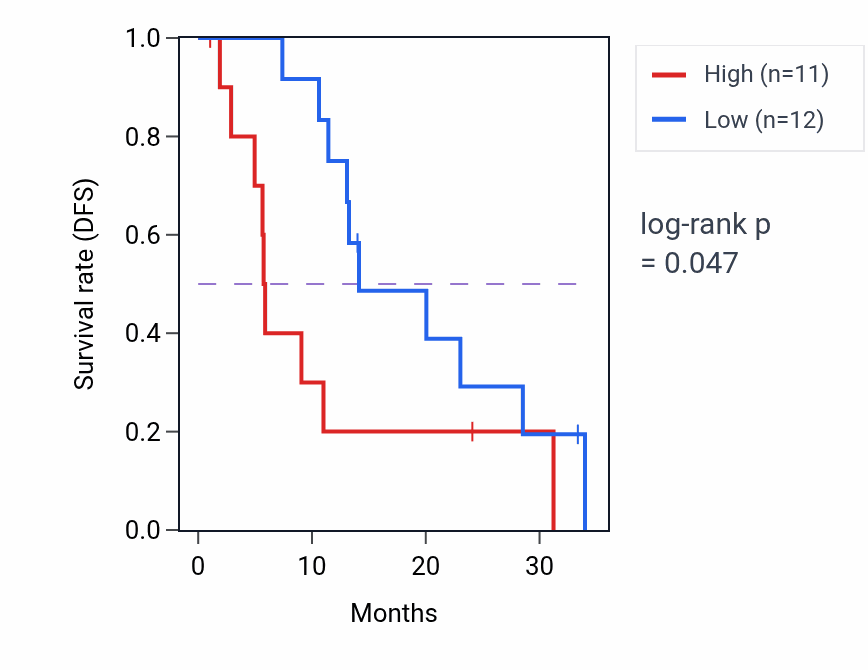
The strongest signal is observed in pancreatic ductal adenocarcinoma (PDAC), where higher PEAK1 mass-spec protein is associated with worse disease-free survival. In most high-consensus cancer types, elevated PEAK1 expression acts as an unfavorable survival marker, although some lineages such as HNSC and CCRCC show a favorable association.
PDAC, LSCC, and HNSC are the cancer types where PEAK1 mass-spec protein most reproducibly stratifies survival.
mass-spec protein survival associations by lineage
Ranked by sampling consensus. AUC1 and AUC2 indicate survival in the high- and low-expression groups, respectively; the lower AUC marks the poorer-surviving group. p-values are from the log-rank test.
Pink = unfavorable, green = favorable. Showing the 6 strongest of 6 lineages.
Exploration
- Same gene, other analysis: PEAK1 tumor-vs-normal RNA expression · all PEAK1 data types