OR2AG1

RNA expression — cross-omics
Cross-omicsRNA → FUNCTION-RNACell-linePairwise association · TCGA cohorts

Across TCGA cell cohorts, OR2AG1 RNA expression is significantly associated with the go_rna of many other GO terms, with 921 significant associations in total. BLOOD_Lymphoma shows the largest number of these associations.

The most reproducible OR2AG1-associated GO terms across cancer lineages are Negative regulation of DNA-templated transcription, elongation, mRNA cis splicing, via spliceosome, and Regulation of mRNA splicing, via spliceosome. Each is linked with OR2AG1 in more than 5 cancer types. Because this analysis shows association rather than direction, both OR2AG1-to-partner and partner-to-OR2AG1 results are reported.

Each partner links to its own Q-omics profile. The box plot shows the strongest example, Negative regulation of DNA-templated transcription, elongation grouped by OR2AG1-low versus OR2AG1-high in BLOOD_Myeloma.

RNA expression associated GO terms by consensus

Ranked by combined sampling and lineage consensus. X-score (OR2AG1→partner) and Y-score (partner→OR2AG1) are standardized regression coefficients; both directions are reported because the association is undirected. p-values are from the association test.
LineagePartner GO termX-scoreY-scorep(X)p(Y)Sampling consensusLineage consensus
BLOOD_MyelomaNegative regulation of DNA-templated transcription, elongation →+0.051+0.048.003.00236
BLOOD_LeukemiamRNA cis splicing, via spliceosome →+0.035+0.040.008.00836
UPPER_AERODIGESTIVE_TRACTRegulation of mRNA splicing, via spliceosome →+0.076+0.023<.001.00835
LARGE_INTESTINESynaptic transmission, cholinergic →-0.103-0.016.001.00835
PANCREASmiRNA metabolic process →+0.077+0.015.003.00135
BLOOD_LeukemiaPositive regulation of viral process →+0.037+0.040<.001.00335
Each partner links to its Q-omics profile. Showing the 6 strongest of 921 associations by consensus.

Negative regulation of DNA-templated transcription, elongation by OR2AG1 expression — BLOOD_Myeloma
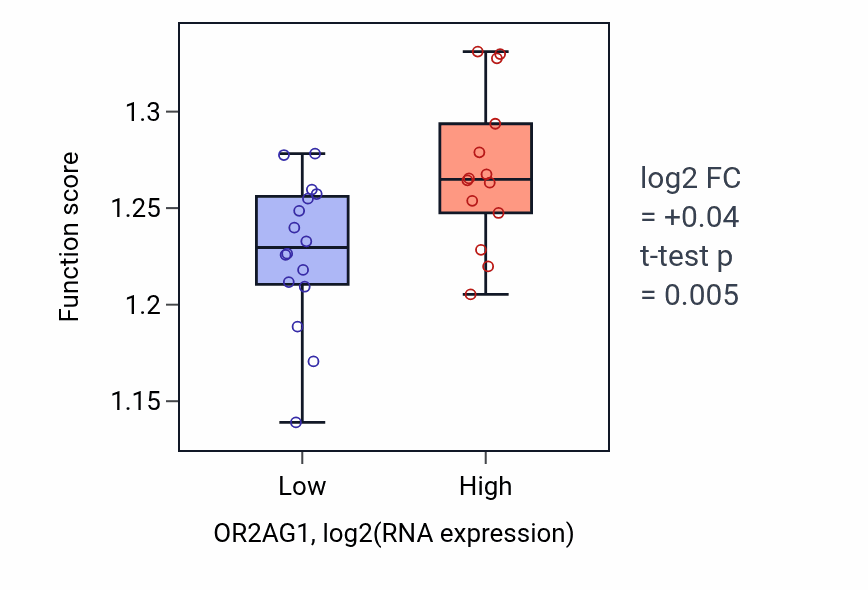
Box plot of Negative regulation of DNA-templated transcription, elongation in OR2AG1-low vs OR2AG1-high samples in BLOOD_Myeloma.

Explore this box plot interactively →

Exploration