NRG2

RNA expression — cross-omics
Cross-omicsRNA → FUNCTION-RNACell-linePairwise association · TCGA cohorts

Across TCGA cell cohorts, NRG2 RNA expression is significantly associated with the go_rna of many other GO terms, with 3,005 significant associations in total. BLOOD_Lymphoma shows the largest number of these associations.

The most reproducible NRG2-associated GO terms across cancer lineages are Regulation of heart rate by cardiac conduction, Regulation of actin filament-based movement, and Regulation of cardiac muscle cell contraction. Each is linked with NRG2 in more than 10 cancer types. Because this analysis shows association rather than direction, both NRG2-to-partner and partner-to-NRG2 results are reported.

Each partner links to its own Q-omics profile. The box plot shows the strongest example, Regulation of heart rate by cardiac conduction grouped by NRG2-low versus NRG2-high in OESOPHAGUS.

RNA expression associated GO terms by consensus

Ranked by combined sampling and lineage consensus. X-score (NRG2→partner) and Y-score (partner→NRG2) are standardized regression coefficients; both directions are reported because the association is undirected. p-values are from the association test.
LineagePartner GO termX-scoreY-scorep(X)p(Y)Sampling consensusLineage consensus
OESOPHAGUSRegulation of heart rate by cardiac conduction →-0.227-0.671.006.005311
LUNG_NSCLC_LUADRegulation of actin filament-based movement →-0.181-0.864<.001<.001311
URINARY_TRACTRegulation of cardiac muscle cell contraction →-0.160-0.953<.001.002311
STOMACHBundle of His cell to Purkinje myocyte communication →-0.250-0.657<.001.00839
KIDNEYNegative regulation of post-translational protein modification →+0.074+0.857.001.00839
STOMACHCardiac conduction →-0.220-1.282<.001<.00139
Each partner links to its Q-omics profile. Showing the 6 strongest of 3,005 associations by consensus.

Regulation of heart rate by cardiac conduction by NRG2 expression — OESOPHAGUS
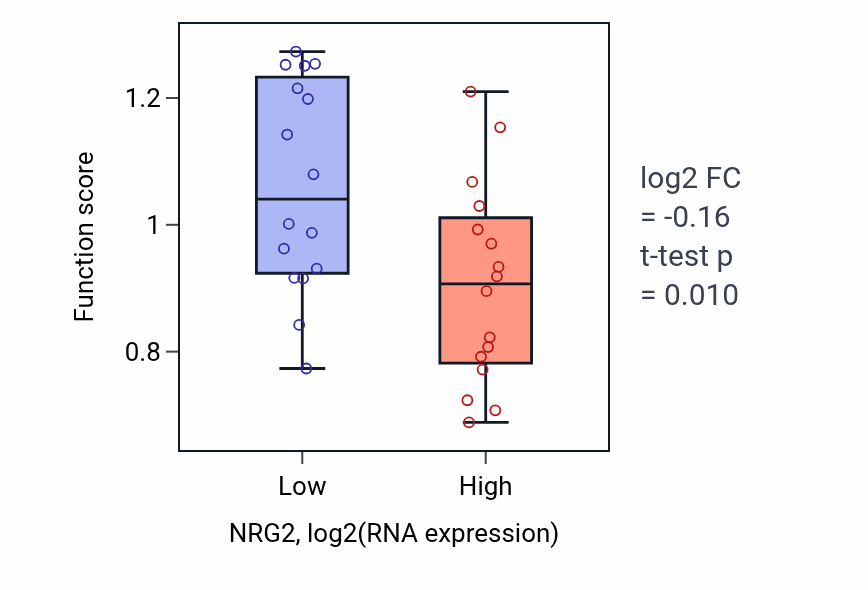
Box plot of Regulation of heart rate by cardiac conduction in NRG2-low vs NRG2-high samples in OESOPHAGUS.

Explore this box plot interactively →

Exploration