GLYATL1P2
RNA — tumor vs normalAcross TCGA pan-cancer cohorts, GLYATL1P2 RNA differs between tumor and matched normal tissue in 10 of 18 cancer types tested, making tumor–normal expression one of GLYATL1P2’s most consistent transcriptional readouts.
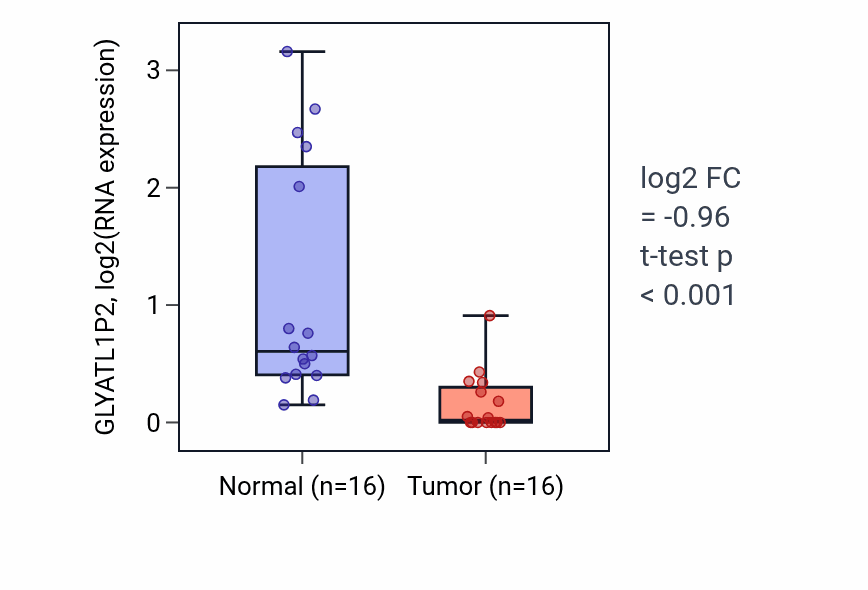
The strongest signal is observed in kidney renal papillary cell carcinoma (KIRP), where GLYATL1P2 RNA is repressed in tumor relative to normal tissue. In most cancer types GLYATL1P2 is over-expressed in tumor, although a few such as KIRP and KICH show the opposite, repressed pattern.
KIRP, BRCA, and LUSC are the cancer types where GLYATL1P2 tumor–normal differential expression is most reproducible.
RNA tumor vs normal associations by lineage
Ranked by sampling consensus. Fold-change is the tumor-versus-normal difference in GLYATL1P2 RNA (log2); positive values indicate higher expression in tumor. p-values are from the differential-expression test.
Pink = over-expressed in tumor, green = repressed in tumor. Showing the 10 strongest of 10 lineages.
Exploration
- Same gene, other analysis: GLYATL1P2 RNA expression & survival · all GLYATL1P2 data types