FAM90A3P
associated omics dataQ-omics provides the consensus-scored FAM90A3P profile across patient tissues and cancer cell-line models. FAM90A3P expression is associated with patient survival in 1 of 34 cancer types, with the highest sampling consensus in OV.
Every result is evaluated using two consensus scores. Sampling consensus measures how consistently a finding is reproduced within a cancer lineage across different conditions. Lineage consensus measures how broadly the result is shared across cancer types, distinguishing pan-cancer signals from lineage-specific patterns.
Premium analyses for FAM90A3P — synthetic lethality, tumor antigen, and pembrolizumab response.
View premium →Survival associations
This table summarizes FAM90A3P survival associations across molecular data types. FAM90A3P RNA expression shows survival associations in the most cancer types (1). The rightmost column indicates the cancer type with the highest sampling consensus for each molecular layer.
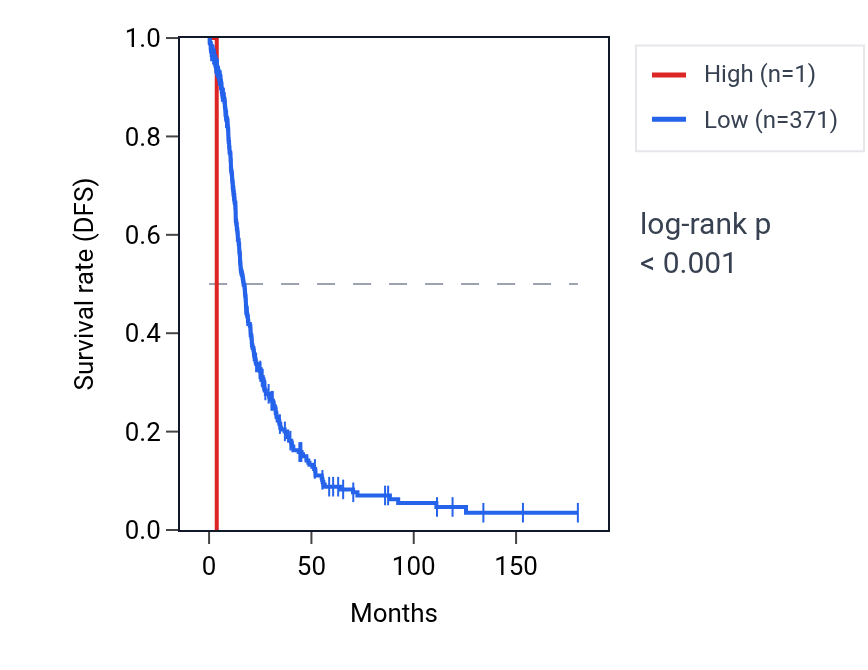
This table ranks reproducible FAM90A3P RNA expression–survival associations across cancer types. High FAM90A3P expression shows unfavorable associations in OV. The OV Kaplan–Meier curve shows clear separation, with the high-expression group declining faster, consistent with the unfavorable association (log-rank p < 0.001). Together, the overview and detailed table identify OV as the clearest survival context for FAM90A3P RNA expression.