CRYBB2

RNA expression — cross-omics
Cross-omicsRNA → FUNCTION-RNAPatientPairwise association · TCGA cohorts

Across TCGA patient cohorts, CRYBB2 RNA expression is significantly associated with the go_rna of many other GO terms, with 7,012 significant associations in total. KIRC shows the largest number of these associations.

The most reproducible CRYBB2-associated GO terms across cancer lineages are Positive regulation of sphingolipid biosynthetic process, Proton motive force-driven ATP synthesis, and Nucleolar large rRNA transcription by RNA polymerase I. Each is linked with CRYBB2 in more than 17 cancer types. Because this analysis shows association rather than direction, both CRYBB2-to-partner and partner-to-CRYBB2 results are reported.

Each partner links to its own Q-omics profile. The box plot shows the strongest example, Positive regulation of sphingolipid biosynthetic process grouped by CRYBB2-low versus CRYBB2-high in GBM.

RNA expression associated GO terms by consensus

Ranked by combined sampling and lineage consensus. X-score (CRYBB2→partner) and Y-score (partner→CRYBB2) are standardized regression coefficients; both directions are reported because the association is undirected. p-values are from the association test.
LineagePartner GO termX-scoreY-scorep(X)p(Y)Sampling consensusLineage consensus
GBMPositive regulation of sphingolipid biosynthetic process →+0.043+0.472<.001<.001317
STADProton motive force-driven ATP synthesis →+0.061+0.234<.001<.001317
SCLCNucleolar large rRNA transcription by RNA polymerase I →+0.083+0.380.002.006118
SCLCPositive regulation of DNA repair →+0.047+0.413.001<.001316
STADOxidative phosphorylation →+0.037+0.196<.001<.001316
UCECSpermidine metabolic process →+0.033+0.476<.001<.001316
Each partner links to its Q-omics profile. Showing the 6 strongest of 7,012 associations by consensus.

Positive regulation of sphingolipid biosynthetic process by CRYBB2 expression — GBM
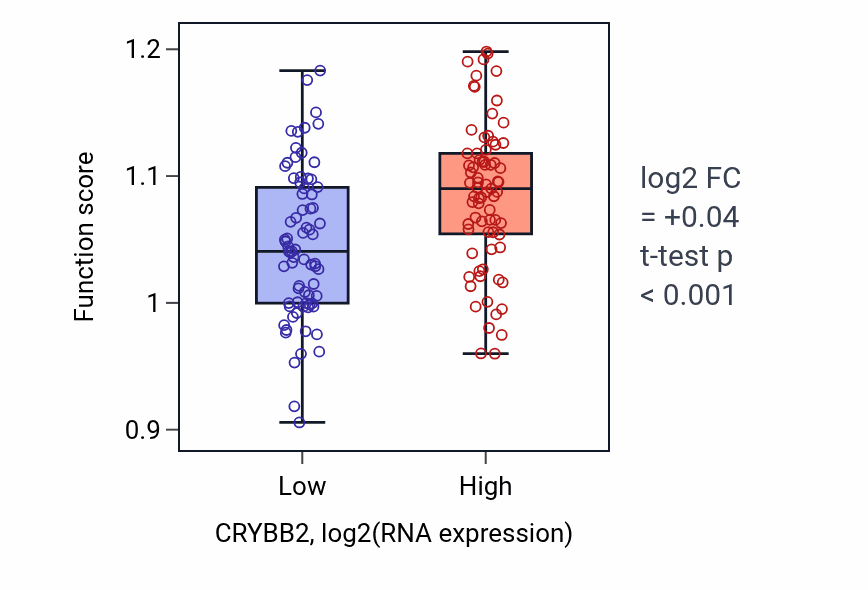
Box plot of Positive regulation of sphingolipid biosynthetic process in CRYBB2-low vs CRYBB2-high samples in GBM.

Explore this box plot interactively →

Exploration