CRACR2A

RNA expression — cross-omics
Cross-omicsRNA → FUNCTION-RNACell-linePairwise association · TCGA cohorts

Across TCGA cell cohorts, CRACR2A RNA expression is significantly associated with the go_rna of many other GO terms, with 4,118 significant associations in total. BLOOD_Leukemia shows the largest number of these associations.

The most reproducible CRACR2A-associated GO terms across cancer lineages are Maturation of SSU-rRNA, Mitotic chromosome movement towards spindle pole, and rRNA transcription. Each is linked with CRACR2A in more than 9 cancer types. Because this analysis shows association rather than direction, both CRACR2A-to-partner and partner-to-CRACR2A results are reported.

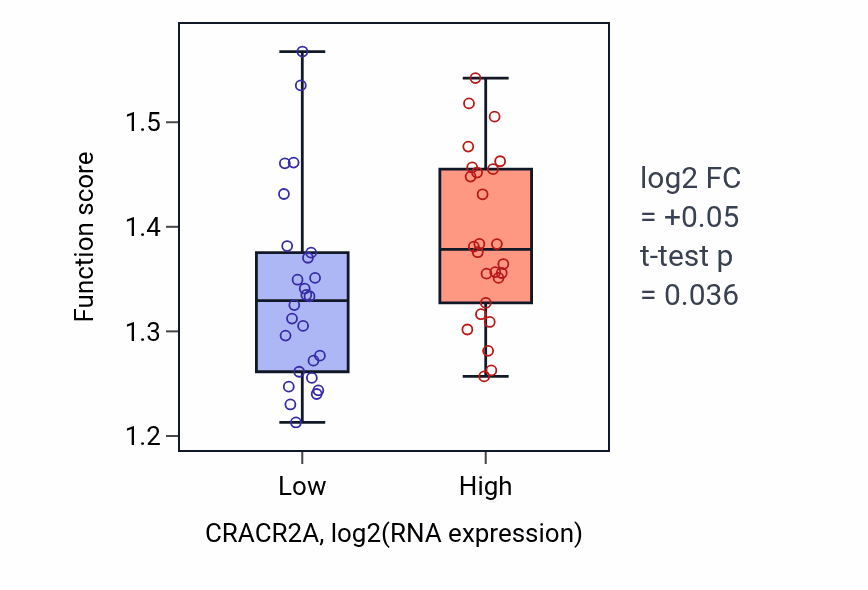
Each partner links to its own Q-omics profile. The box plot shows the strongest example, Maturation of SSU-rRNA grouped by CRACR2A-low versus CRACR2A-high in LUNG_SCLC.
RNA expression associated GO terms by consensus

Ranked by combined sampling and lineage consensus. X-score (CRACR2A→partner) and Y-score (partner→CRACR2A) are standardized regression coefficients; both directions are reported because the association is undirected. p-values are from the association test.
LineagePartner GO termX-scoreY-scorep(X)p(Y)Sampling consensusLineage consensus
LUNG_SCLCMaturation of SSU-rRNA →+0.091+1.904<.001<.001310
KIDNEYMitotic chromosome movement towards spindle pole →+0.104+1.661.002.00239
BLOOD_MyelomarRNA transcription →+0.087+1.105<.001.00339
BLOOD_LymphomaRibosome biogenesis →+0.093+1.194<.001<.00139
UPPER_AERODIGESTIVE_TRACTDNA topological change →+0.093+0.980<.001.00539
STOMACHMicrotubule depolymerization →+0.112+1.943<.001<.00139
Each partner links to its Q-omics profile. Showing the 6 strongest of 4,118 associations by consensus.

Maturation of SSU-rRNA by CRACR2A expression — LUNG_SCLC

Box plot of Maturation of SSU-rRNA in CRACR2A-low vs CRACR2A-high samples in LUNG_SCLC.

Explore this box plot interactively →

Exploration