CFAP92

RNA expression — cross-omics
Cross-omicsRNA → FUNCTION-RNACell-linePairwise association · TCGA cohorts

Across TCGA cell cohorts, CFAP92 RNA expression is significantly associated with the go_rna of many other GO terms, with 3,022 significant associations in total. BONE shows the largest number of these associations.

The most reproducible CFAP92-associated GO terms across cancer lineages are Substrate adhesion-dependent cell spreading, Copper ion export, and Regulation of plasminogen activation. Each is linked with CFAP92 in more than 10 cancer types. Because this analysis shows association rather than direction, both CFAP92-to-partner and partner-to-CFAP92 results are reported.

Each partner links to its own Q-omics profile. The box plot shows the strongest example, Substrate adhesion-dependent cell spreading grouped by CFAP92-low versus CFAP92-high in SOFT_TISSUE.

RNA expression associated GO terms by consensus

Ranked by combined sampling and lineage consensus. X-score (CFAP92→partner) and Y-score (partner→CFAP92) are standardized regression coefficients; both directions are reported because the association is undirected. p-values are from the association test.
LineagePartner GO termX-scoreY-scorep(X)p(Y)Sampling consensusLineage consensus
SOFT_TISSUESubstrate adhesion-dependent cell spreading →-0.189-0.457<.001<.001311
BONECopper ion export →-0.163-0.406<.001.00639
BREASTRegulation of plasminogen activation →-0.203-0.960<.001<.00139
LUNG_NSCLC_LUADRegulation of thrombin-activated receptor signaling pathway →-1.153-0.682<.001.00239
LUNG_NSCLC_LUADNegative regulation of thrombin-activated receptor signaling pathway →-1.153-0.682<.001.00239
OVARYNegative regulation of mRNA metabolic process →+0.073+0.491.003.00838
Each partner links to its Q-omics profile. Showing the 6 strongest of 3,022 associations by consensus.

Substrate adhesion-dependent cell spreading by CFAP92 expression — SOFT_TISSUE
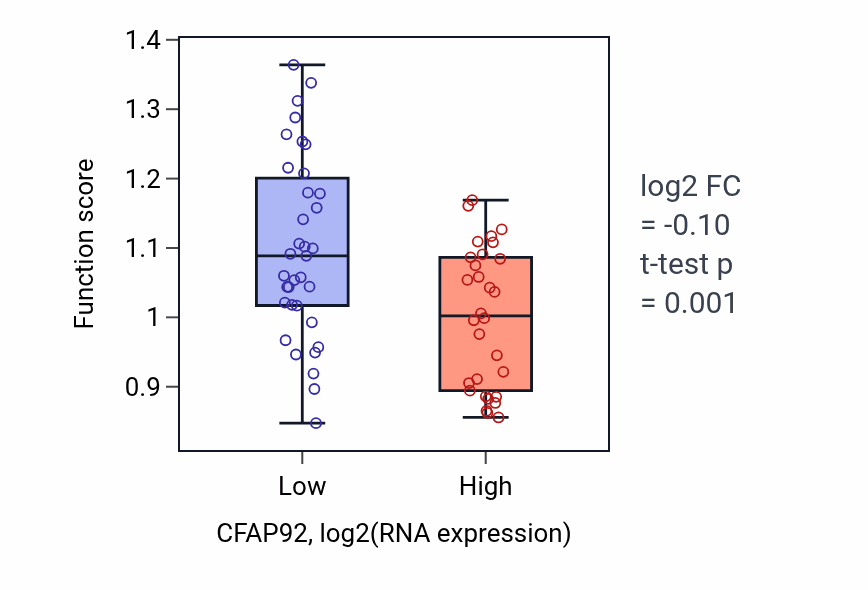
Box plot of Substrate adhesion-dependent cell spreading in CFAP92-low vs CFAP92-high samples in SOFT_TISSUE.

Explore this box plot interactively →

Exploration