CDC14B

RNA expression — cross-omics
Cross-omicsRNA → FUNCTION-RNACell-linePairwise association · TCGA cohorts

Across TCGA cell cohorts, CDC14B RNA expression is significantly associated with the go_rna of many other GO terms, with 5,411 significant associations in total. BLOOD_Lymphoma shows the largest number of these associations.

The most reproducible CDC14B-associated GO terms across cancer lineages are Vesicle-mediated transport to the plasma membrane, Macroautophagy, and Regulation of translational initiation. Each is linked with CDC14B in more than 11 cancer types. Because this analysis shows association rather than direction, both CDC14B-to-partner and partner-to-CDC14B results are reported.

Each partner links to its own Q-omics profile. The box plot shows the strongest example, Vesicle-mediated transport to the plasma membrane grouped by CDC14B-low versus CDC14B-high in BONE.

RNA expression associated GO terms by consensus

Ranked by combined sampling and lineage consensus. X-score (CDC14B→partner) and Y-score (partner→CDC14B) are standardized regression coefficients; both directions are reported because the association is undirected. p-values are from the association test.
LineagePartner GO termX-scoreY-scorep(X)p(Y)Sampling consensusLineage consensus
BONEVesicle-mediated transport to the plasma membrane →+0.081+1.349.002.006312
OVARYMacroautophagy →+0.047+0.654.001.002311
SKINRegulation of translational initiation →+0.075+1.025<.001<.001311
OVARYRegulation of post-translational protein modification →+0.061+0.662.001.003310
BLOOD_LymphomaNegative regulation of myoblast fusion →+0.102+2.061<.001<.00139
UPPER_AERODIGESTIVE_TRACTNegative regulation of syncytium formation by plasma membrane fusion →+0.116+1.090.001<.00139
Each partner links to its Q-omics profile. Showing the 6 strongest of 5,411 associations by consensus.

Vesicle-mediated transport to the plasma membrane by CDC14B expression — BONE
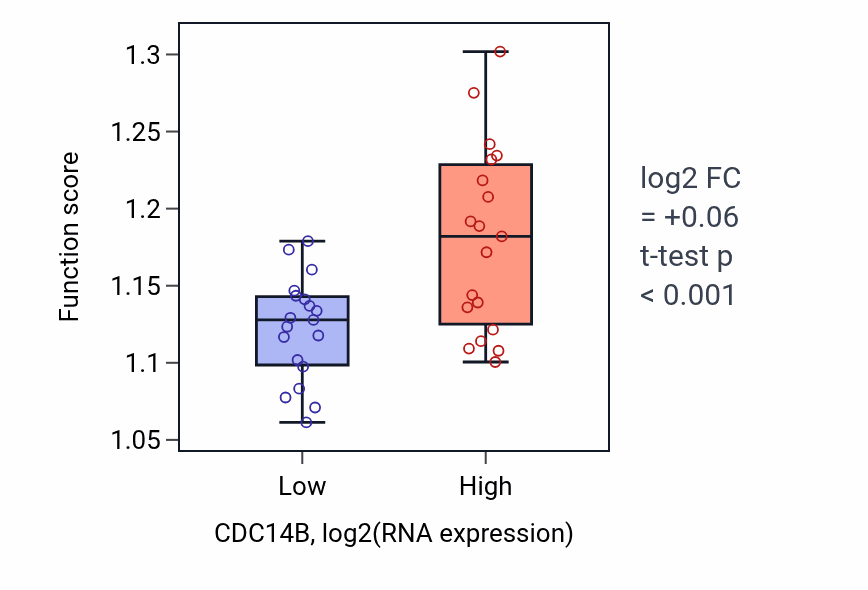
Box plot of Vesicle-mediated transport to the plasma membrane in CDC14B-low vs CDC14B-high samples in BONE.

Explore this box plot interactively →

Exploration