Flavopiridol
response biomarkers — cross-omicsAcross CCLE and GDSC cell-line panels, response to Flavopiridol is significantly associated with the RNA expression of multiple genes, with BLOOD_Leukemia cell lines showing a particularly strong set of associations.
The most reproducible Flavopiridol response-associated genes across cancer lineages are BCL2L1, RRAS, and SIL1, each associated with drug response in up to 10 lineages. Since the analysis identifies associations rather than directional relationships, both response-to-biomarker and biomarker-to-response views are provided.
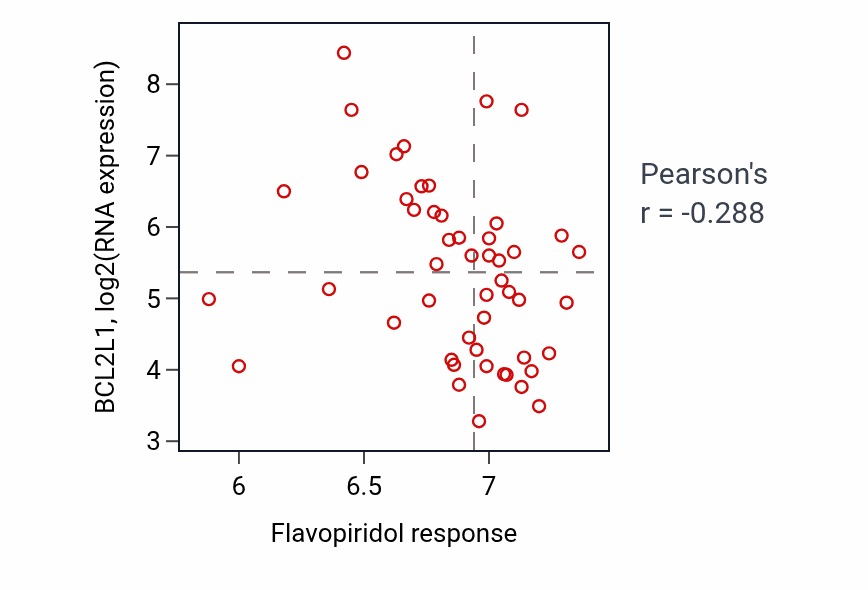
Each biomarker is linked to its corresponding Q-omics profile. The scatter plot shows the strongest observed association, Flavopiridol response versus BCL2L1 RNA expression in BLOOD_Leukemia (Pearson r = -0.29).
Rna expression biomarkers of Flavopiridol response
Exploration
- full Flavopiridol cross-omics profile · other biomarker types are linked from the drug overview.